proIMS Presentation Framework
The proIMS Web Framework is a set of tools which can be used to display the content generated by the proIMS Framework as HTML Page for Web browser or as WebPart for Windows SharePoint server and Cloud applications.
The main user interface to the proIMS is a comprehensive dashboard, which is an easy to read, multi-page, real-time user interface, showing a graphical presentation of the current status (snapshot) or historical trends of the plants to enable instantaneous and informed decisions to be made at a glance.
Based on an equipment and asset tree on the left, visual components can be dragged and dropped to the information area of the web page and animated with data from the databases.

The dashboard has a set of predefined components, which are integrated to the underlying RTDB. RTDB signals can be easily 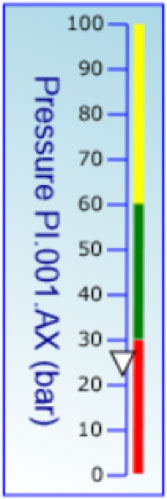 assigned to the board components and displayed.
The current dashboard frame work contains the following elements:
- Trends
- Charts (Area Charts, Bar Charts, Stock Charts, Gauges)
- Process Views
- Tables to show Realtime or historical data
- Manual Input component
- Operator LOG formulars
- HTML5 Applets to display logos, headers or standard HTML content
- KPI Displays and summaries
- Integrated document manager
- Excel Export of process date
proIMS Editor
The proIMS editor is a WYSIWYG web-based tool to configure the dashboards.
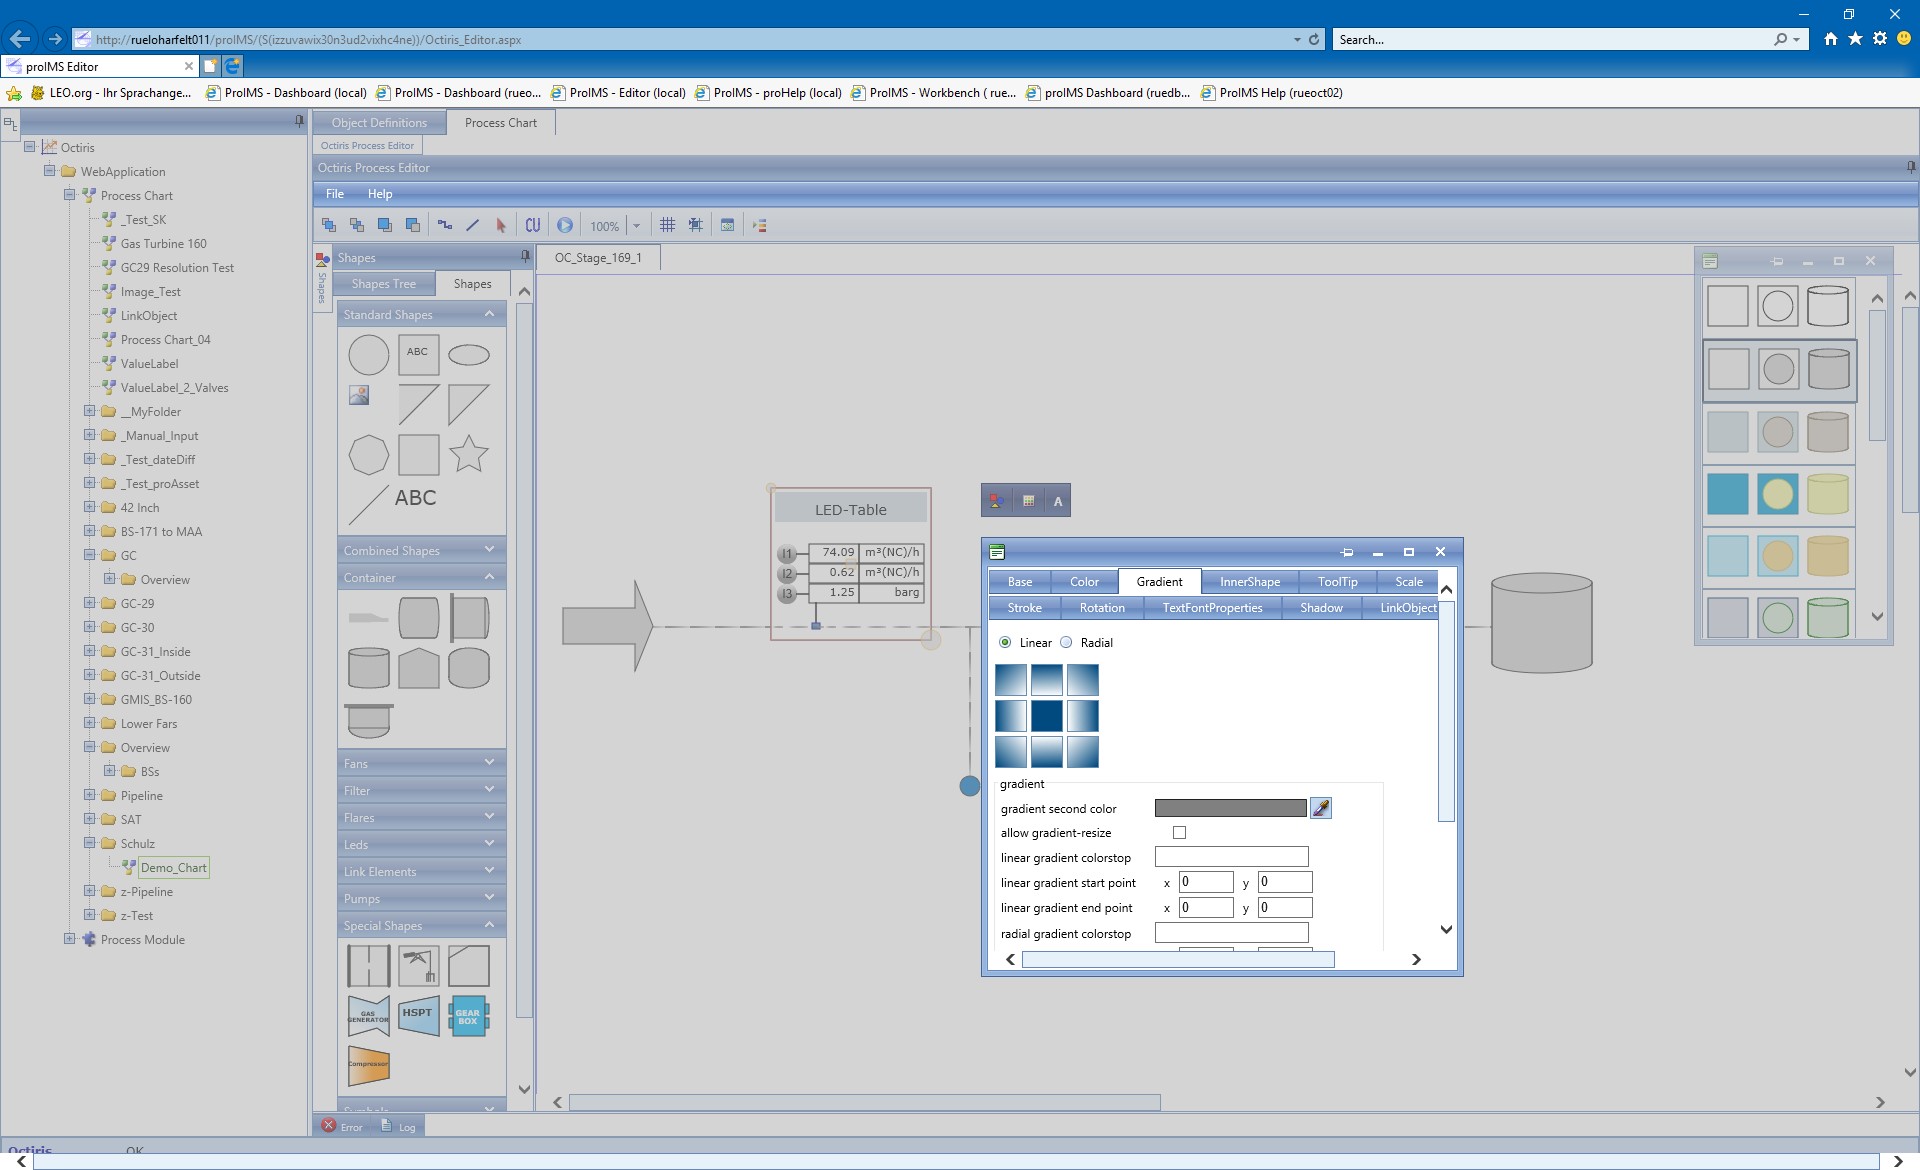
Process Views, trends, manual input pages and other proIMS elements can be easily configured. Based on this elements comprehensive Dashboards can be created using drag and drop functionality.